
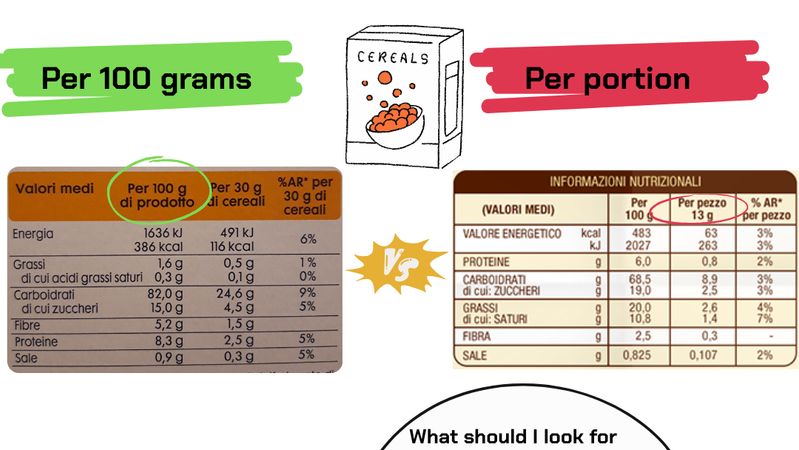
Have you ever found yourself in the supermarket, trying to choose the healthiest yogurt, the cereal with the least sugar, or the most balanced packet of crackers, only to feel completely confused by the labels? One product looks great “per portion,” but then you notice the indicated portion size is tiny! Another lists “per 100 g” values that seem high, but perhaps the amount you’d actually eat is different. What’s the right way to compare and make truly informed choices? Let’s unveil the secret together
The Pitfall of “Manufacturer’s Portion”: Why It Can Be Deceiving
The portion sizes indicated on food packaging are determined by manufacturers and, let’s be clear, can vary enormously and don’t always reflect actual consumption. A bag of chips might show seemingly low nutritional values for a “portion” of just 25 g, but who among us really stops at that amount? This approach makes an honest and transparent comparison between similar products difficult. Here are the main pitfalls
- Unrealistic PortionsOften, suggested portions are significantly smaller than what a person normally consumes in a single sitting
- Extreme VariabilityThe “portion” of breakfast cereal can be 30 g for one brand and 45 g for another, making a direct comparison based solely on those values impossible
- Hidden MarketingSmall portions can make a product appear “lighter” or lower in sugar/fat than it actually is when consumed in more realistic quantities
Blindly relying on “per portion” values can therefore lead you to make less healthy choices than you think, without even realizing it
Understanding “Standard Portions”: What Do the Guidelines Say?
Fortunately, beyond the arbitrary manufacturer portions, there arestandard reference portionsThese are indicative quantities defined by authoritative bodies likeEFSA(European Food Safety Authority) and national nutrition societies—often based on Dietary Reference Values (DRVs) or national guidelines (such as LARN in Italy). Knowing these standard portions helps you understand how much of a certain food is generally recommended to consume within a balanced diet
Indicative Standard Portions for Common Food Categories
| Food Category | Food | Indicative Standard Portion |
|---|---|---|
| Pasta, Rice, Cereals | Spaghetti, Basmati Rice, Bread | Pasta/Rice (dry): 70-80g; Bread: 50g (1 small roll or 2 medium slices); Breakfast Cereal: 30-40g |
| Fresh Meat | Sliced Steak (Tagliata) | Red or White: 100g |
| Fresh Fish | Common Octopus | Whole or fillet: 150g |
| Canned Fish | Canned Tuna, Salmon | Drained: 50g |
| Legumes | Chickpeas | Dry: 50g; Cooked/Fresh: 150g |
| Eggs | Eggs | 1 medium (approx. 50g) |
| Cheeses | Generic Cheese | Fresh (e.g., mozzarella): 100g; Hard (e.g., Parmesan): 50g |
| Vegetables | Lettuce | Leafy greens (raw): 80g; Other vegetables (cooked/raw): 200g |
| Fresh Fruit | Melon, Strawberry, Cherry | 150g (1 medium fruit or 2 small) |
| Yogurt | Greek Yougurt | 125g (1 standard pot) |
| Cold Cuts/Deli Meats | Salami | 50g |
DisclaimerThese are reference quantities. Individual needs may vary based on age, sex, physical activity level, health status, and specific goals. Always consult a nutrition professional for personalized advice
The Superpower of 100 g/100 ml: The Objective Comparison
If standard portions give us an idea ofhow muchto eat, how do we choosewhichproduct is best? This is where theper 100 g(or100 mlfor liquids) comparison comes in. In the European Union (Regulation EU No 1169/2011) and many other countries, it’s mandatory to also list nutritional values on this basis. This is the true “universal yardstick” for the following reasons
- It’s StandardizedAll similar products (e.g., all yogurts, all biscuits) can be compared on the exact same quantitative basis
- It’s ObjectiveIt doesn’t depend on what the manufacturer decides a “portion” is, eliminating marketing influence
- It’s TransparentIt gives you a clear idea of the product’s nutritional density. A product with 30 g of sugar per 100 g is objectively higher in sugar than one with 5 g per 100 g, regardless of the suggested serving size
Want to know if yogurt A has less sugar than yogurt B? Compare the grams of sugar per 100 g. Want to choose crackers with less salt? Look at the value per 100 g. It’s simple, direct, and effective
How to Combine Both: Standard Portions and 100 g Comparison
The winning strategy is to use both pieces of information
- Use Standard Portions(from EFSA or national guidelines) to get an idea of how much of a certain food you should consume
- Use Per 100 g/100 ml Valuesto compare similar products and choose the one with the best nutritional profile for your needs (e.g., less sugar, fewer saturated fats, more fiber)
ExampleYou know a portion of breakfast cereal is about 30–40 g. To choose which cereal to buy, compare different brands by looking at sugar, fiber, and fat values per 100 g. Once you’ve chosen the best product, you’ll weigh out your reference portion
Luminatens: Your Smart Nutritional Compass
We know that reading, interpreting, and comparing labels can take time, attention, and sometimes even a calculator. That’s whyLuminatensdoes the heavy lifting for you, becoming your smart nutritional compass
When you scan a label with Luminatens
- Automatically Extracts Values per 100 gOur app focuses on standardized data to give you an immediate, reliable, and comparable overview
- Calculates Scores Based on 100 gOur personalized nutritional ratings are based on this objective standard, applying scientific guidelines (EFSA and WHO) to help you quickly understand product quality
- Facilitates Direct ComparisonYou can save scans in your history and quickly see the nutritional differences between products, always based on 100 g
- Tracks Your Actual PortionsAfter comparing and choosing the best product based on 100 g, you can easily indicate the amount you actually consumed in the “History” section of the app. This allows you to monitor the real nutritional impact of your portion while still maintaining the consistency of objective product comparison
With Luminatens, you no longer have to do mental calculations or squint to find the right line on the label. You instantly get the information that matters for a real comparison and accurate tracking of your diet
In Conclusion: The Golden Rule for Conscious Choices
The next time you’re at the supermarket shelf, remember this simple but fundamental ruleto truly compare two food products, always look at the nutritional values per 100 g or 100 mlIt’s the only way to make a truly informed and objective choice. Once you’ve chosen the best product, adjust the quantity to your reference portion
And if you want to make this whole process even easier, faster, and more personalized, letLuminatensbe your pocket guide!
Key Takeaways
- “Manufacturer’s portions” can be misleadingand vary widely
- “Standard portions”(from EFSA DRVs or national guidelines) provide a useful reference for quantities
- Always use per 100 g/100 ml valuesfor an objective comparison between similar products
- Luminatensanalyzes data per 100 g to give you reliable ratings and helps you track your actual portions
Frequently Asked Questions (FAQ)
Q: What’s the right portion of pasta or rice?AGenerally, for an adult, a portion of dry pasta or raw rice is about 70–80 g. For fresh tortellini, a portion might be around 125–150 g. Always check the per 100 g values to choose the type with more fiber or less sodium
Q: And for Greek yogurt, which is so trendy?AA standard yogurt portion is 125 g (one pot). For Greek yogurt, often denser, the portion can be similar or slightly larger (150 g). Always compare sugar and protein values per 100 g across different brands
Q: How do these portions fit into a specific diet, like an athlete’s or a low-calorie diet?AStandard portions serve as a starting point. Specific diets require personalized adjustments. It’s always advisable to consult a nutritionist or dietitianLuminatenshelps you monitor the intake of individual foods, making it easier to adhere to your personalized plan
Ready to Truly Compare and Eat More Mindfully?
DownloadLuminatenstoday from the Google Play Store! Start making more informed food choices based on clear, comparable, and personalized data. Your health will thank you!
Leave a review